 DC Area Posts Highest October Home Sales in 3 Years As Inventory Falls
✉️ Want to forward this article? Click here.
DC Area Housing Metrics in October.
After a typically slow September, last month the DC area home market posted the highest level of sales for October in three years, as the active inventory fell below 9,000 homes for the first time since July 2005.
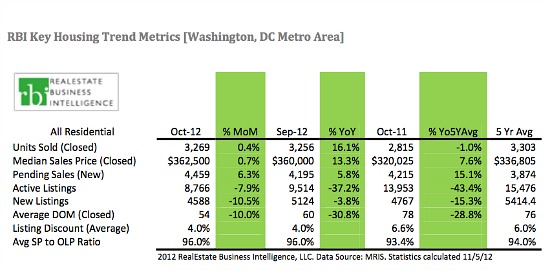
On Monday, RealEstate Business Intelligence reported that there were 3,269 home sales in October in the metro area, a 16.1 percent increase over October 2011. Sales in the condo segment saw the largest jump, up 23.4 percent from a year ago, followed by single-family home sales (+14.2 percent) and then townhome sales with a 12.6 percent gain. While the year-over-year gains are impressive, the more interesting statistic is actually the sales change from September 2012 to October 2012. Typically, sales fall off about 4 percent between September and October; however, between last month and this month, sales actually rose a modest 0.4 percent.
While sales increased, the level of new and active inventory continues to fall. From RBI:
There were 8,766 active listings in the Washington DC Metro Area at the end of October, 37.2 percent lower than this time last year. This is the first time the number of active listings has dropped below 9,000 since July 2005. October active listings in the region are nearly half of what they were 2 years ago, indicating dramatic property absorption in the market. All property segments experienced year-over-year inventory reductions exceeding 40 percent. The 4,588 new listings in the region are the lowest October-level since 1999, an indication of a persisting pattern of low supply.
DC Area Home Prices in October.
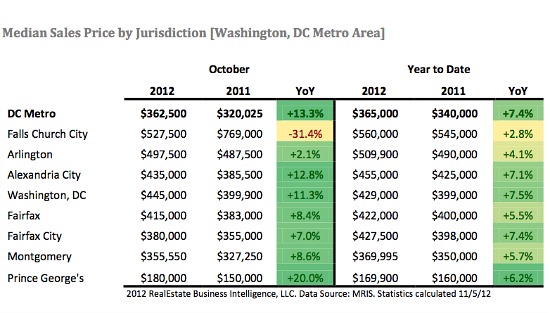
The low inventory of homes on the market pushed prices upward in October. At $362,500, the median home sales price in the DC area is 13.3 percent higher than October 2011. This represents the highest year-over-year increase for any month since December 2005. A breakdown of price by specific area can be seen above.
The thumbnail photo is a home for sale at 1811 8th Street NW.
See other articles related to: dc home and condo prices, home prices, housing inventory, realestate business intelligence
This article originally published at http://dc.urbanturf.production.logicbrush.com/articles/blog/dc_area_posts_highest_october_home_sales_in_3_years/6283.


UrbanTurf Listings showcases the DC metro area's best properties available for sale.

Most Popular... This Week • Last 30 Days • Ever

Why condo fees are high in some buildings and low in others can be a difficult questi... read »

In this edition of First-Timer Primer, we look into the question of how to determine ... read »

A Roth IRA is one of those accounts that people feel is totally off limits until you ... read »

On this day of 100+ degree heat, we take a look at a novel proposal aiming to bring r... read »

This is one of the more intriguing adaptive reuse proposals of the year.... read »


DC Real Estate Guides
Short guides to navigating the DC-area real estate market
We've collected all our helpful guides for buying, selling and renting in and around Washington, DC in one place. Start browsing below!
First-Timer Primers
Intro guides for first-time home buyers
Unique Spaces
Awesome and unusual real estate from across the DC Metro