What's Hot: Did January Mark The Bottom For The DC-Area Housing Market? | The Roller Coaster Development Scene In Tenleytown and AU Park
 The Most Interesting DC Housing Data From the American Community Survey
✉️ Want to forward this article? Click here.
Yesterday, the Census Bureau released the most recent data from the annual American Community Survey (ACS), so we decided to pull out some of the most interesting data that the ACS offer about housing in the District of Columbia as of 2016.
Here is a quick rundown:
story continues below
loading...story continues above
- In 2016, the population of the District of Columbia was 681,170, of which 277,268 residents self-identified as white (40.7 percent) and 320,554 self-identified as Black (47 percent). In 2009, the total population was 599,657 and those percentages were 38.7 and 53 percent, respectively.
- Over 60 percent of all occupied housing units in the city are rentals. Forty percent of renter households are led by people aged 35 and younger.
- 73 percent of renters moved into their units between 2010 and 2016. Over 62 percent of renters live in buildings with 10 or more apartment units.
- Of the occupied housing stock in DC, 32 percent are one-bedrooms and 45 percent are 2-3 bedrooms. For rentals, it is nearly reversed: 43.6 percent are one-bedrooms and 36 percent are 2-3 bedrooms.
- A quarter of DC renter households spends at least half of their household income on rent.
- Gross rent for apartments built between 2010-2013 is $1,708 a month. Meanwhile, gross rent for apartments built from 2000-2009 is $2,060 a month and for apartments built in 2014 or later is $2,132 a month.
- While 37 percent of all households in DC don’t have a vehicle, over half of renter households are car-free.
- The median annual household income for homeowners with mortgages is $143,414; less than one-third of mortgaged homeowners earn less than $100,000 annually.
- Homeowners with mortgages spend $2,422 monthly on housing costs on median. Nearly 26 percent of homeowners with mortgages spend at least 30 percent of their income on monthly expenses.
- While 57 percent of the working population of DC residents is aged 25-44, people in that age range only represent 54.9 percent of the workers who drive alone to get to work. This may be partially due to the rise in bicycle commuters, which grew by 46 percent in the District over the past five years.
- Just over a quarter of District residents work for the government compared to 70 percent in the private sector. This is a slight shift from 2009, when nearly 28 percent of DC residents were government workers compared to 67 percent of workers in the private sector.
- Nearly three-quarters of DC residents also work in the District.
More data from the ACS is available here. Look for more analysis of this data from UrbanTurf next week.
See other articles related to: census, dc, demographics
This article originally published at http://dc.urbanturf.production.logicbrush.com/articles/blog/the_most_interesting_dc_housing_data_from_the_american_community_survey/13011.
Most Popular... This Week • Last 30 Days • Ever
As mortgage rates have more than doubled from their historic lows over the last coupl... read »
The small handful of projects in the pipeline are either moving full steam ahead, get... read »

The longtime political strategist and pollster who has advised everyone from Presiden... read »
A report out today finds early signs that the spring could be a busy market.... read »
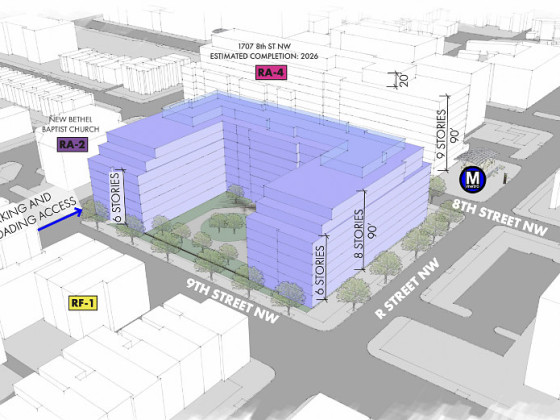
Lincoln-Westmoreland Housing is moving forward with plans to replace an aging Shaw af... read »
DC Real Estate Guides
Short guides to navigating the DC-area real estate market
We've collected all our helpful guides for buying, selling and renting in and around Washington, DC in one place. Start browsing below!
First-Timer Primers
Intro guides for first-time home buyers
Unique Spaces
Awesome and unusual real estate from across the DC Metro
