What's Hot: Did January Mark The Bottom For The DC-Area Housing Market? | The Roller Coaster Development Scene In Tenleytown and AU Park
 In Northern Virginia, Home Prices Have Been Rising For Years
✉️ Want to forward this article? Click here.
The real estate talk in the DC area over at least the last year has been the consistent increase in home prices. But Northern Virginia appears to be in a class by itself.
RealEstate Business Intelligence (RBI) recently put together a few graphs that illustrate the ups and downs of housing prices in the DC area compared with prices in the rest of the country. RBI’s Corey Hart graphed the changes in median sale price over the last five years in the region, and then overlayed the changes in national median sale prices with a blue line.
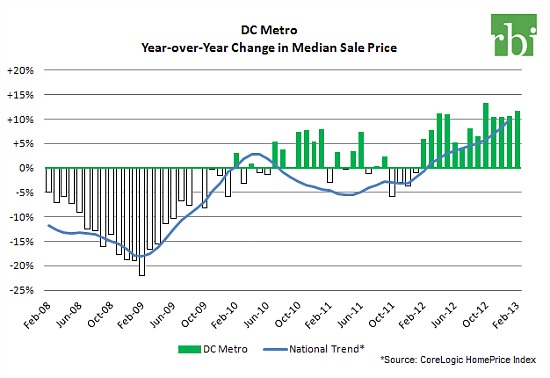
Courtesy of RBIntel.
As the graph indicates, home prices in the DC Metro seemed to begin their recovery in mid-2010, while national home prices began their steady rise in February 2012. (DC’s market does show some stops and starts until February 2012, when prices started rising on a quarterly basis.)
However, as the graph for Northern Virginia shows, home prices have more or less been rising there for the last four years. Unlike the DC Metro area, NoVa’s median sale prices have been steadily increasing since July 2009.
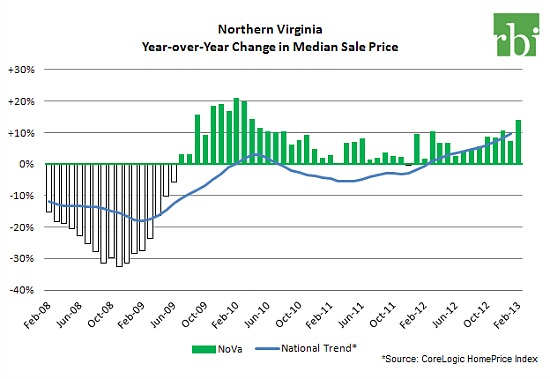
Courtesy of RBIntel.
RBI’s Corey Hart provided UrbanTurf with some insight into the chart above:
It really comes down to jobs. Even during the height of the recession, the unemployment rate in Northern Virginia stayed south of 6 percent (it’s below 4 percent to begin 2013). The relative health of the job market continued to bring new workers into the area, and as importantly, kept folks already in the local labor force here. This meant demand (new workers seeking housing) grew as supply continued to decline (existing workers staying put). These reasons, combined with a much steeper decline in home prices during the housing crisis compared to other regions, were factors in an earlier turnaround for home prices in Northern Virginia. We’ll be playing close attention to the impacts of the sequestration as it will impact the DC Metro labor force more than any other region, but we’re still predicting continued gains in pricing this spring.
For the full post, and to see the source data, check out RBIntel.
See other articles related to: housing market trends, northern virginia, northern virginia home prices, realestate business intelligence
This article originally published at http://dc.urbanturf.production.logicbrush.com/articles/blog/the_dc_housing_market_recovery_in_graphs/6871.
Most Popular... This Week • Last 30 Days • Ever
As mortgage rates have more than doubled from their historic lows over the last coupl... read »

The small handful of projects in the pipeline are either moving full steam ahead, get... read »

The longtime political strategist and pollster who has advised everyone from Presiden... read »
Lincoln-Westmoreland Housing is moving forward with plans to replace an aging Shaw af... read »
A report out today finds early signs that the spring could be a busy market.... read »
DC Real Estate Guides
Short guides to navigating the DC-area real estate market
We've collected all our helpful guides for buying, selling and renting in and around Washington, DC in one place. Start browsing below!
First-Timer Primers
Intro guides for first-time home buyers
Unique Spaces
Awesome and unusual real estate from across the DC Metro


