 The D.C. and U.S. Rental Market, by the Numbers
✉️ Want to forward this article? Click here.
Harvard University's Joint Center for Housing Studies has released its latest Rental Housing report. Below, UrbanTurf highlights some of the more interesting rental market statistics for the DC and national markets.

- 57.6% -- The share of DC households which are renters.
- 50.8% -- The share of DC apartments renting for at least $1,400 a month in 2018, an increase of 42% since 2008.
- 12.3% -- The share of DC apartments renting for under $600 a month in 2018, a decrease of 3.9% since 2012.
- 26.4% -- The share of DC renters that were severely cost-burdened* in 2018, on par with the share of 26% in 2008. Across the metro area, this share is 23.9%.
- 35.6% -- The share of Black DC renters that were severely cost-burdened* in 2018; the share is 15.6% for white DC renters.
- $63,000 -- The median income of DC area renters. Renters pay a median of $1,630 in monthly housing costs.
- 350,000 -- The number of new renters on the market in the U.S. during the first three quarters of 2019. The number of renters had fallen by 222,000 between 2016 and 2018.
- 545,000 -- The number of new renters on the market with an income of $75,000 or more between 2016 and 2018.
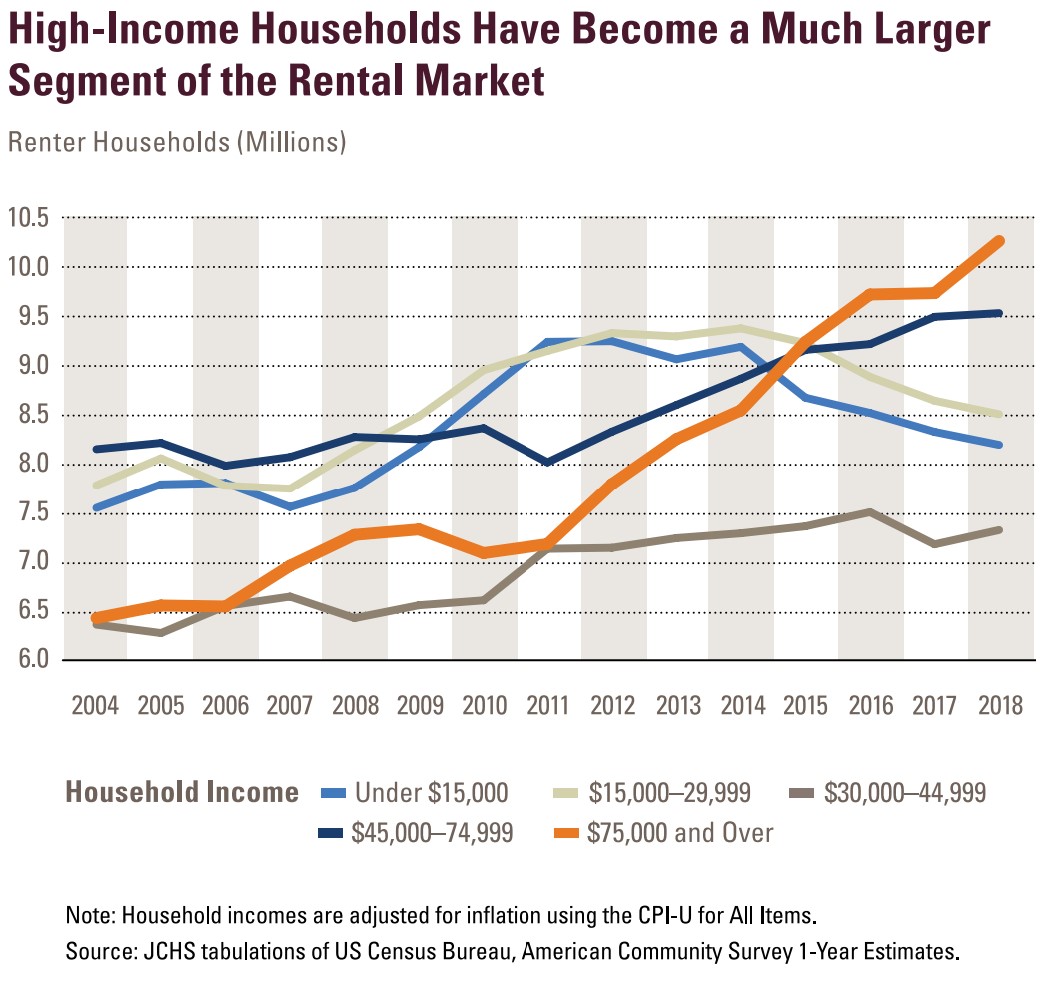
- 2.7 million fewer homeowner households were comprised of families with children in 2018 than in 2004. The share of families with children that are renter households increased by 680,000 over that same time, accounting for 29% of renter households.
- 61% -- The share of new multifamily units in buildings with 50 or more units in 2018. In the 1990s, the share averaged around 11%.
- $1,620 -- The median rent for unfurnished apartments constructed between July 2018 and June 2019. Twenty percent of new apartments rent for $2,450 or higher, while only 12% rent for less than $1,050.
- 39% -- How much construction costs have increased between 2012 and mid-2019, including taxes, fees, labor, and materials.
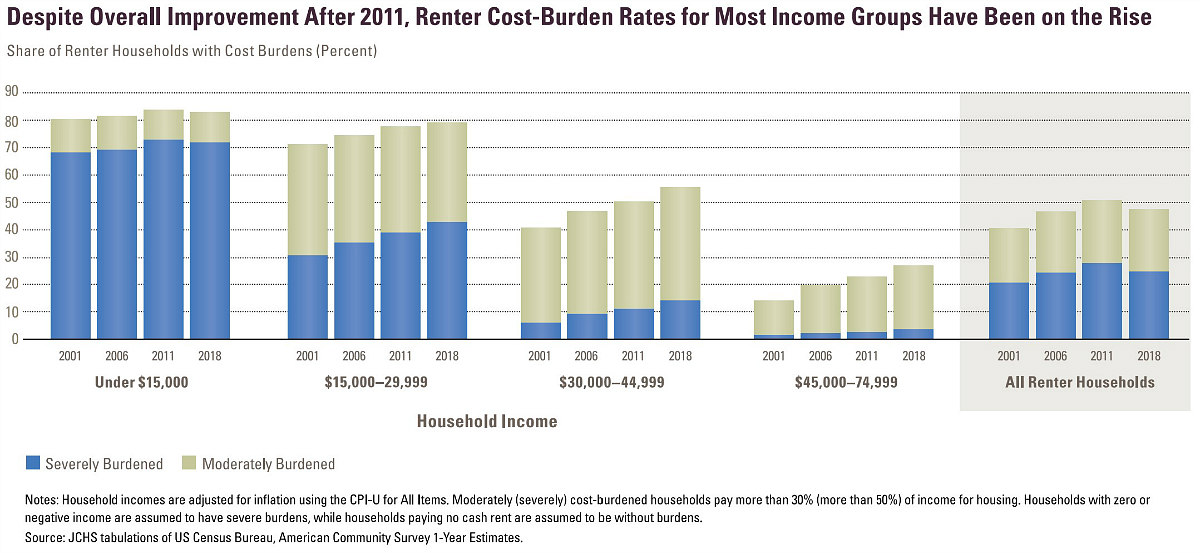
- 10.9 million -- The number of households that spent more than half their income on rent in 2018, accounting for one in 4 renter households.
- $67,300 -- The household income required to buy a house in one of the 127 largest metro areas in 2018. This is 26% higher than the income required to buy a house in these areas in 2013 ($53,300).
- 2.2 million of 2.8 million households that purchased a home from 2010-2018 had incomes of at least $200,000.
*The report defines "cost-burdened" as spending more than 30% of income on rent and utilities. "Severely cost-burdened" households spend at least 50% of income on rent and utilities.
See other articles related to: affordability, harvard, housing affordability, jchs, joint center for housing studies, nationwide rental market, rent affordability, renters, renting
This article originally published at http://dc.urbanturf.production.logicbrush.com/articles/blog/the-dc-and-us-rental-market-by-the-numbers/16411.


UrbanTurf Listings showcases the DC metro area's best properties available for sale.

Most Popular... This Week • Last 30 Days • Ever

UrbanTurf is re-running its primer on property taxes which outlines a few things that... read »
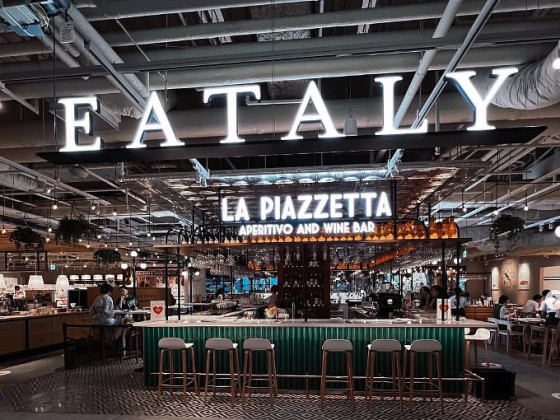
The wait for Eataly in the DC area has been a long one.... read »
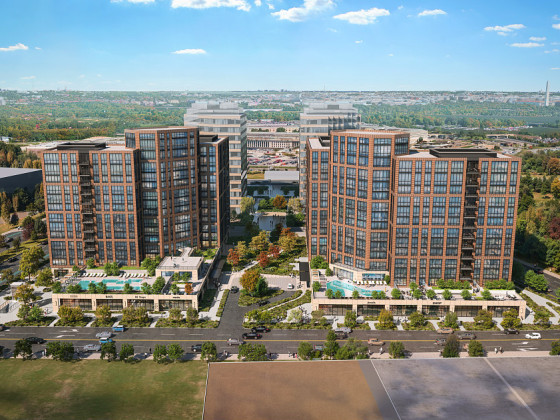
The Arlington County Board signed off on a pair of transformative residential project... read »
The plan to add a shade structure along the Cleveland Park commercial corridor has re... read »

DOGE doesn't seem dead yet; Monument buys Inn of Rosslyn; and Costco gas stations are... read »


DC Real Estate Guides
Short guides to navigating the DC-area real estate market
We've collected all our helpful guides for buying, selling and renting in and around Washington, DC in one place. Start browsing below!
First-Timer Primers
Intro guides for first-time home buyers
Unique Spaces
Awesome and unusual real estate from across the DC Metro