 Home Prices Rise 13.2 Percent as Rate of Growth Declines
✉️ Want to forward this article? Click here.
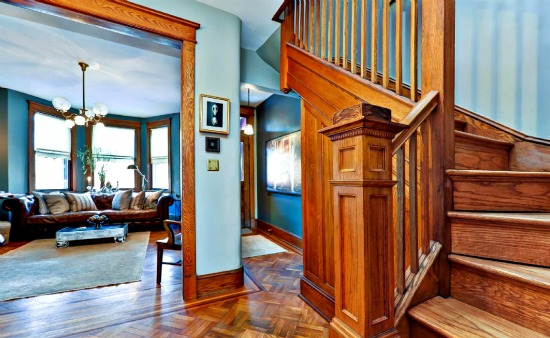
Inside a Mount Pleasant home that recently sold.
The S&P’s home price index showed year-over-year gains of 13.2 percent in January, down from 13.4 percent in December, as month-to-month prices revealed slight declines.
Home sales are at their lowest level since July 2012, according to the latest Case-Schiller report. Last month’s report, which looked at December numbers, warned that signs were pointing to a slowdown, and this month’s decline, tracking data through January, isn’t unexpected.
New York City and the DC area “stood out as they continued to improve and posted their highest year-over-year returns since 2006,” according to David Blitzer, the index committee chairman at S&P Dow Jones Indices. In DC, prices rose 9.2 percent and in New York City, prices increased 6.7 percent.
From the report:
“The housing recovery may have taken a breather due to the cold weather. Twelve cities reported declining prices in January vs. December; eight of those were worse than the month before. From the bottom in 2012, prices are up 23% and the housing market is showing signs of moving forward with more normal price increases. Expectations and recent data point to continued home price gains for 2014. Although most analysts do not expect the same rapid increases we saw last year, the consensus is for moderating gains,” Blitzer said.
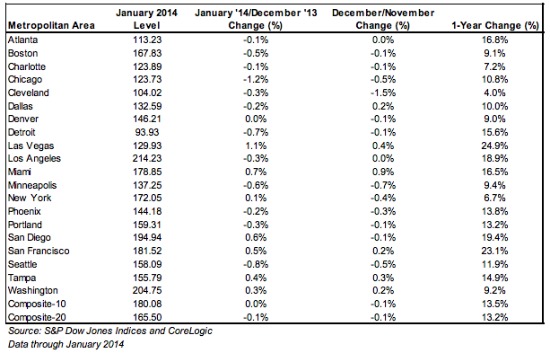
The 20-city composite, which is the broadest measure of home prices the report offers, posted its third monthly decline in a row, dropping 0.1 percent in January. Still, the DC area was one of seven metros with positive monthly returns in January, and one of just two wintry cities; also gaining were Las Vegas, Miami, New York, San Diego, San Francisco and Tampa. Average home prices have returned to levels seen around mid-2004, the report said.
The Case-Shiller Disclaimer
When considering the Case-Shiller findings, recall that the index is based on closed sales and home price data from several months ago. (A better indicator of where area prices stand right now in the region is the most recent report from RealEstate Business Intelligence.) Also important to note: The main index only covers single-family home prices, so co-op and condo prices are not included in the analysis that is widely reported. Chicago and New York City are two of the cities where Case-Shiller provides a separate index for condo prices, but DC does not have a similar index.
Lastly, and perhaps most importantly when considering the conclusions of the index, the area covered by Case-Shiller can only very loosely be described as the “DC area.” According to the site, the following cities are included: DC, Calvert MD, Charles MD, Frederick MD, Montgomery MD, Prince Georges MD, Alexandria City VA, Arlington VA, Clarke VA, Fairfax VA, Fairfax City VA, Falls Church City VA, Fauquier VA, Fredericksburg City VA, Loudoun VA, Manassas City VA, Manassas Park City VA, Prince William VA, Spotsylvania VA, Stafford VA, Warren VA, Jefferson WV.
See other articles related to: case-shiller, dclofts, home prices
This article originally published at http://dc.urbanturf.production.logicbrush.com/articles/blog/home_prices_slow_in_january_as_rate_of_growth_declines/8274.
Most Popular... This Week • Last 30 Days • Ever
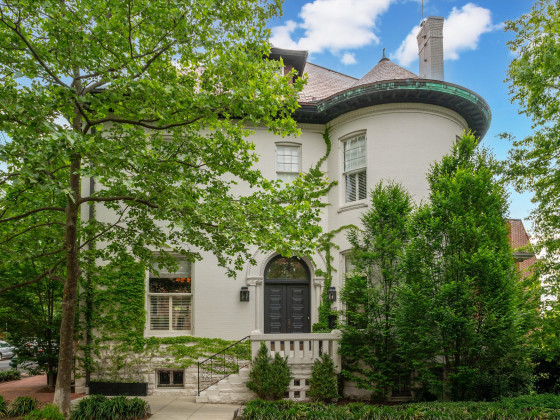
Chris Hughes and husband Sean Eldridge are putting their Kalorama home on the market ... read »
Today, UrbanTurf is taking a look at the tax benefits associated with buying a home t... read »
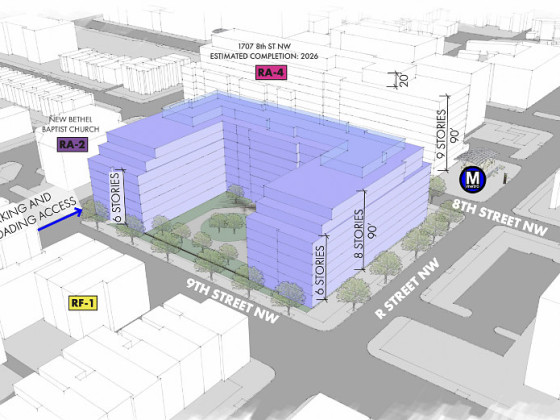
Lincoln-Westmoreland Housing is moving forward with plans to replace an aging Shaw af... read »

Only a few large developments are still in the works along 14th Street, a corridor th... read »

A soccer stadium in Baltimore; the 101 on smart home cameras; and the epic fail of th... read »
DC Real Estate Guides
Short guides to navigating the DC-area real estate market
We've collected all our helpful guides for buying, selling and renting in and around Washington, DC in one place. Start browsing below!
First-Timer Primers
Intro guides for first-time home buyers
Unique Spaces
Awesome and unusual real estate from across the DC Metro


