 The Severity of Displacement in DC: By the Numbers
✉️ Want to forward this article? Click here.
A study that was recently released by the National Community Reinvestment Coalition stating that Washington, DC experienced the most intense gentrification and displacement of any city since 2000 has gained a lot of traction. Now, the University of Minnesota Law School's Institute on Metropolitan Opportunity (IMO) has released a study entitled "American Neighborhood Change in the 21st Century" that delves further into the numbers illustrating these changes.
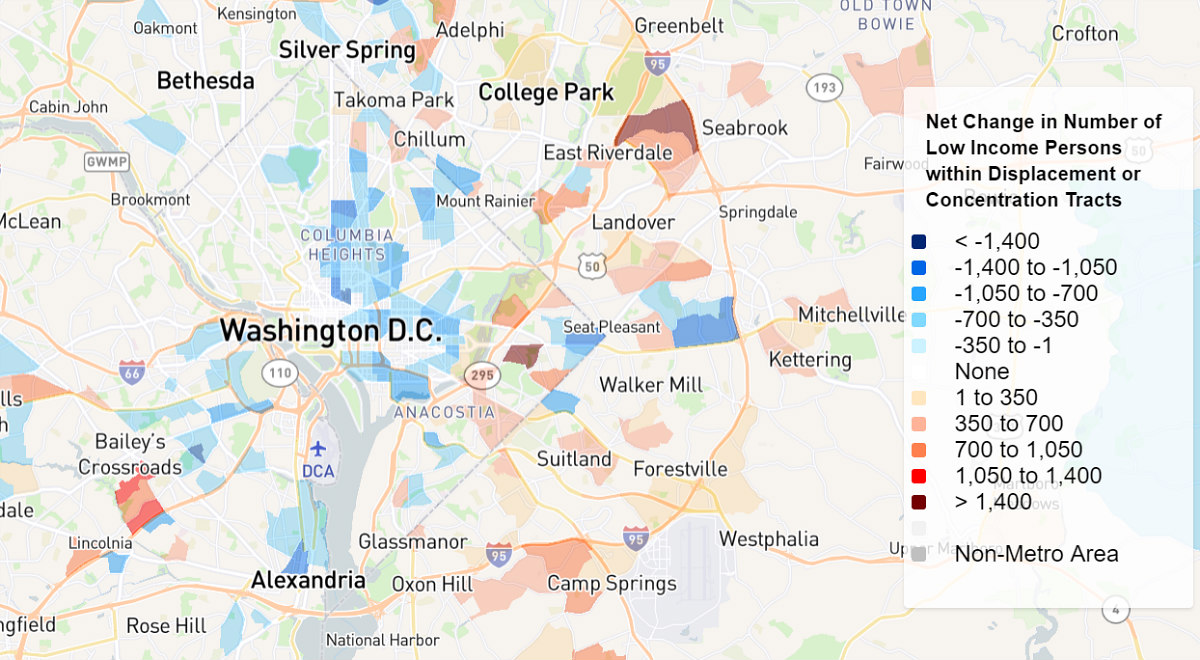
While the IMO study agrees that DC experienced the most severe gentrification and displacement nationwide since 2000, the study also offers more statistics to illustrate this shift. UrbanTurf highlights some of the more interesting points below; all are since 2000 and in areas with strong indicators of expansion or decline, unless specified otherwise:
- Between 2000 and 2016, the population of DC's economically expanding areas grew by 19 percent, and the white population in particular increased by 201.8 percent (or 60,399 residents).
- Compared to 2000, there are 22,939 (or 24.7 percent) fewer low-income residents, and 34,520 (or 23.4 percent) fewer Black residents, in economically expanding areas of the city.
- There are also 5,130 (or 20.8 percent) fewer families, and 10,473 (21.9 percent) fewer children under the age of 18 in economically expanding areas of the city.
- The number of housing units in the city's economically expanding areas increased by 11,379 for ownership units and by 10,174 for rental units, and the number of vacant units has fallen by 719 (or 6.2 percent).
- There are 8,308 more low-income residents in the city's economically declining areas.
- There are also 1,471 additional college-educated residents in economically declining areas of the District, an increase of 26.3 percent.
- There are 1,318 (17 percent) fewer ownership housing units in economically declining areas, while rental units have increased by 2,187 (20 percent) and vacant units have increased by 1,002 (54 percent).
- Roughly 437,000 residents of DC's suburbs live in economically declining areas, where low-income population has grown by 70 percent and white population has decreased by 30 percent.
The report defines "low income" as 200 percent of the poverty level or lower. Most data comes from the American Community Survey.
See other articles related to: displacement, gentrification, maps
This article originally published at http://dc.urbanturf.production.logicbrush.com/articles/blog/the-severity-of-displacement-in-dc-by-the-numbers/15266.
Most Popular... This Week • Last 30 Days • Ever
With frigid weather hitting the region, these tips are important for homeowners to ke... read »
Today, UrbanTurf offers a brief explanation of what it means to lock in an interest r... read »
An application extending approval of Friendship Center, a 310-unit development along ... read »
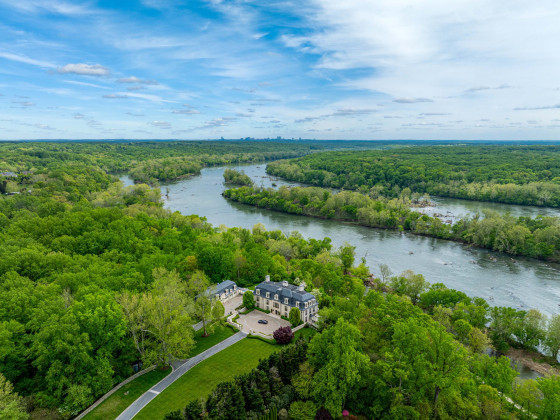
The 30,000 square-foot home along the Potomac River sold at auction on Thursday night... read »
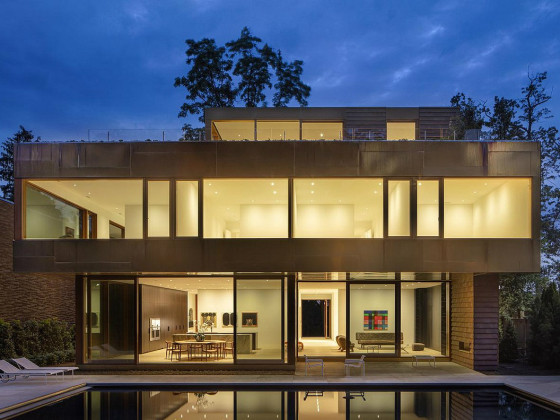
The number of neighborhoods in DC where the median home price hit or exceeded $1 mill... read »
DC Real Estate Guides
Short guides to navigating the DC-area real estate market
We've collected all our helpful guides for buying, selling and renting in and around Washington, DC in one place. Start browsing below!
First-Timer Primers
Intro guides for first-time home buyers
Unique Spaces
Awesome and unusual real estate from across the DC Metro


