 The DC Area's Highest and Lowest Carbon Footprints
✉️ Want to forward this article? Click here.
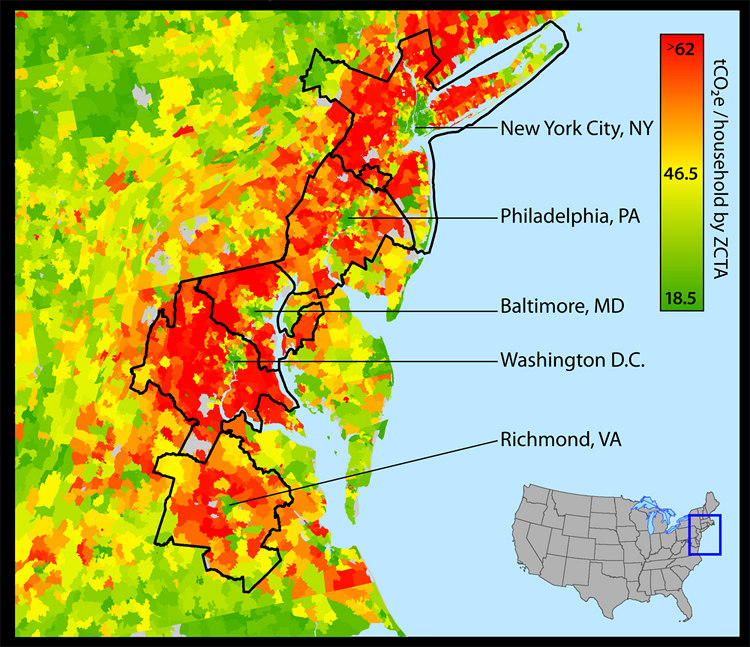
Six years ago, a report was released which highlighted how suburbanization contributes to the high output of greenhouse gases. Now, a map illustrates just how that output looks — and some of the more egregious and energy-efficient zip codes in the DC area may come as a surprise.
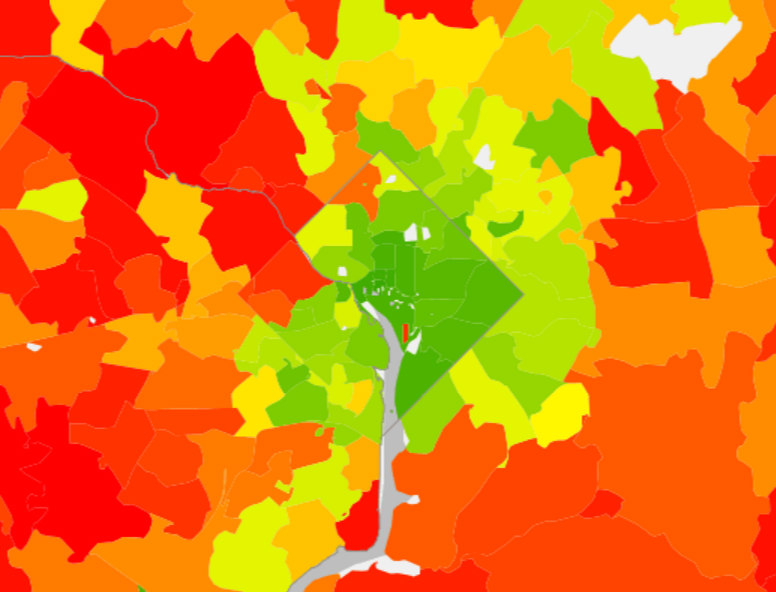
The UC Berkley CoolClimate Network has published an interactive map that offers a micro-level snapshot of energy consumption. DC proper has some of the area's lowest carbon footprints with the 20005 zip code, which is primarily occupied by the Logan Circle neighborhood, leading the way. Here, the average household has a carbon footprint of 27.9 annual metric tons, with housing emissions slightly edging out transportation. The only other zip code with an average carbon footprint of less than 30 annual metric tons is 20037.
The DC zip code with the highest emissions output is 20015, where the average household emits 59.2 metric tons of carbon annually. Primarily known for the Chevy Chase neighborhood, transportation emissions exceed housing emissions here, breaking from what is typically observed citywide. The only other zip codes where households tended to have higher transportation than housing emissions are 20016 (48.2 metric tons), 20007 (43.5 metric tons), and 20008 (39.6 metric tons).
story continues below
loading...story continues above
Just across the Maryland-DC line, the 20912 zip code of Takoma Park ("Berkley of the East") has a lower average carbon footprint (43.2 metric tons) than its DC counterpart Takoma (47.9 metric tons), but is far from being an energy-efficient leader in the close-in suburbs. That honor belongs to the Arlington zip code of 22209, where the average Rosslyn household expends 35.9 metric tons of carbon annually. The 20712 zip code of Mount Rainier has the second-lowest average carbon footprint of 38.3 metric tons, followed closely by the 20710 zip code (38.7 metric tons).
With the exception of 20783 (Hyattsville), every Prince George's County zip code which touches DC had higher housing-related emissions than transportation-related emissions. Conversely, all of northern Virginia has higher transportation than housing emissions. This is particularly glaring in the 22101 zip code of McLean, which has perhaps the highest carbon output in the immediate area — a household average of 76.3 metric tons.
All of the data was sourced from a 2013 report, which created an economic model measuring demand for housing, transportation, goods and services based on responses to national surveys.
See other articles related to: carbon footprint, carbon output, energy efficiency, energy efficient, maps
This article originally published at http://dc.urbanturf.production.logicbrush.com/articles/blog/the-dc-areas-highest-carbon-footprints/15455.


UrbanTurf Listings showcases the DC metro area's best properties available for sale.

Most Popular... This Week • Last 30 Days • Ever

In this article, UrbanTurf explores what renters insurance is and what it covers.... read »
Even in a housing market that has shown signs of cooling in 2026, plenty of DC neighb... read »
Janeese Lewis George appears to have won Tuesday's Democratic mayoral primary, puttin... read »

This week’s Best New Listings includes a 100-year old bungalow in Hyattsville and a... read »
The housing market got a late-spring boost in May.... read »


DC Real Estate Guides
Short guides to navigating the DC-area real estate market
We've collected all our helpful guides for buying, selling and renting in and around Washington, DC in one place. Start browsing below!
First-Timer Primers
Intro guides for first-time home buyers
Unique Spaces
Awesome and unusual real estate from across the DC Metro